For cattle producers, taking calves to market is always a calculated risk. Prices can shift overnight due to factors beyond your control—weather, trade uncertainty, feed costs, and more.
The last thing you want is to see your profits disappear because of a sudden market downturn. Protecting your bottom line with Livestock Price Insurance (LPI) is one way to manage your risk and gain peace of mind in an unpredictable market.
With LPI, cow-calf producers reduce price risk and protect against market volatility by buying price insurance for calves they plan to sell between September and February.
Calf price insurance is available for purchase each year from February into June. For 2025, the last day to buy calf insurance is June 12.
“Some farmers think of calf insurance as a bonus cheque and that’s not the way to use it. It’s a way to insure your bottom price to enable you to market your calves better. I know the year I didn’t have calf insurance I was pretty nervous all summer and maybe made some bad marketing decisions. When you have that, you know absolutely what your bottom is for your calf crop and the skies the limit from there. You can market them. You can hold them. I think the secret to the insurance program is the ability to market and to have peace of mind.”
– Chris Sloan, Sloan Cattle Company
Managing risk through trade uncertainty
With ongoing trade uncertainty, producers are taking steps to ensure their bottom-line is protected.
LPI has seen increasing sales this year, as producers choose to protect their planned livestock sales.
In comparison to last year, calf insured units for April are up 43.6 per cent. Overall, there has been a 66 per cent increase in clients purchasing calf, feeder, and fed policies.
Trends show that producers are choosing the highest coverage available when buying calf policies, with 73 per cent of calf purchases using the top coverage for the corresponding policy length.
The most popular expiry dates for calf policies are later October.
Protecting your bottom-line
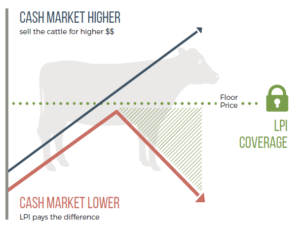
LPI helps cattle and hog producers manage financial risks by providing a buffer against market volatility.
If market prices fall below the insured level, producers receive a payout to cover the difference.
Setting a floor price provides producers with stability so they can plan their operations with more certainty, knowing they have a guaranteed minimum revenue.
Producers can choose different coverage options and policy lengths based on futures markets, with varying premium levels. This flexibility helps you tailor the insurance to your specific needs and market conditions.
Sign up for LPI Premium and Settlement emails to help you monitor the premium tables and keep up to date on market fluctuations.
If you have questions or would like more information, please contact your provincial Livestock Price Insurance office.
Join LPI as we dispel common myths and answer important questions about the Livestock Price Insurance program.
Myth: Producers are required to have livestock at the time a policy is purchased
Depending on the contract, producers are required to keep their existing livestock anywhere from four weeks to 60 days upon entering contract, but they are not required to have livestock at the time a policy is purchased.
Join Brett as he talks about how producers can make management decisions before calving or purchasing livestock.
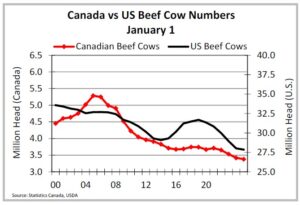
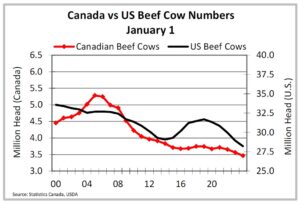
The last cattle cycle was 14 years. From the 2008 peak to 2015 low was seven years, then from 2015 to the 2022 peak was another seven years. Entering another cattle cycle, it should be remembered that cattle numbers are relatively tighter than the 2022 peak, but there is a long way to go, before revisiting the 2015 low. That will not happen until moisture conditions encourage heifer retention to start. In the last cycle, heifer retention started in the fourth quarter of 2013.
The Canadian cattle herd on January 1st, 2025 was down 0.7% from 2024 with beef cows down 1.2%. Improved moisture in May, reduced cow marketing – this will need to continue to fully stabilize the herd. Unfortunately, the weather outlook is for another dry summer in the west. Beef heifers replacements increased a modest 0.8% but remain below levels needed for stabilization, let alone expansion. The U.S. cattle herd on January 1st, 2025 was down 0.9% from 2024 with beef cows down 1%. As carcass weights increase, the inventory low in every cycle is lower than the previous cycle and the high is lower too. As industry becomes more efficient.
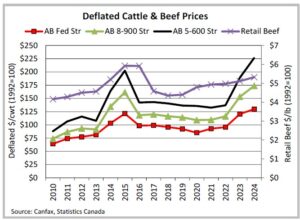
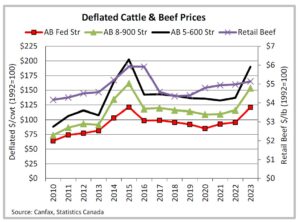
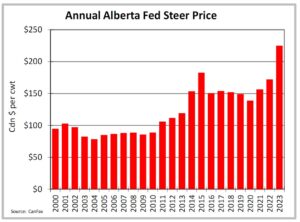
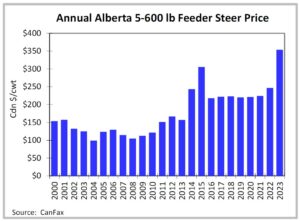
On a deflated basis (1992=100), Alberta fed steer prices were 8% stronger than 2023, moving above their previous high set in 2015. Alberta 550 lb and 850 lb steers also moved above their previous highs. Feeder cattle prices in the last two years have increased more than input costs, supporting cow-calf margins.
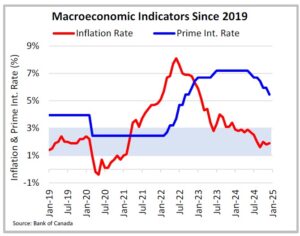
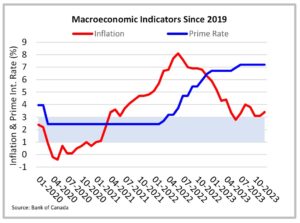
Cuts in the key interest rate in 2024 and 2025 reduced borrowing costs, supporting consumers. However, the unemployment rate is considered to be above the “neutral rate” of 4.9-5.5%. There are 2.4 million more people in the last two years, driven primarily by immigration. The Bank of Canada has forecast GDP growth to be 1.8% in 2025 and 2026. Per capita GDP growth is a major driver of beef consumption and willingness to pay.
Bottom line: The North American cattle herd continues to shrink and smaller slaughter numbers are expected to support prices. Consumer demand was resilient in 2024. US tariffs have the potential to be very disruptive to agricultural markets with volatility driven by uncertainty.
2025 CHALLENGE
The threat of US tariffs on Canadian products remains a concern. On March 7th, there was a pause on the 25% tariff for Mexico and Canadian goods and services covered under CUSMA until April 2nd.
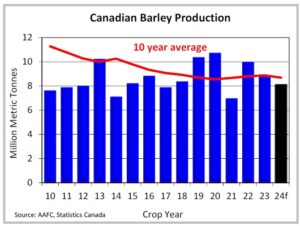
2024/25P BARLEY SUPPLY AND DISPOSITION
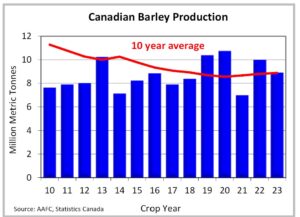
- Canadian barley production was 8.1 million metric tonnes in 2024, down 9% from 2023, and down 2% from the five-year average.
- Barley exports in 2024-25 are projected at three million metric tonnes, down 2% from 2023-24. Total domestic use in 2024/25 is projected at 5.7 million metric tonnes, up 3% from 2023-24.
- Ending stocks in 2024-25 are projected at 700,000 metric tonnes, down 39% and projected to be the second smallest on record going back to 1980.
- The stocks-to-use ratio in 2024-25 is projected at 13%, steady with the five-year average.
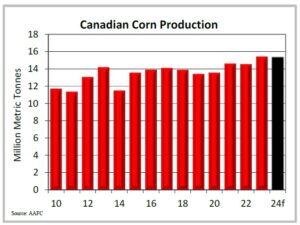
2024/25P CORN SUPPLY AND DISPOSITION
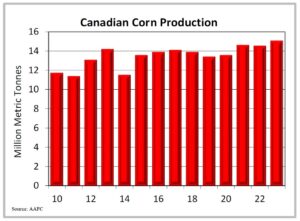
- Canadian corn production was 15.35 million metric tonnes, the second largest on record behind only 2023-24
- Exports in 2024-25 are projected at 2.3 million metric tonnes, up 13% from 2023-24. Total domestic use in 2024-25 is projected at 15.14 million metric tonnes, down 5% from 2023-24.
- Ending stocks in 2024-25 are projected at two million metric tonnes, steady with 2023-24.
- The stocks-to-use ratio in 2024-25 is projected at 13%, compared to the five-year average of 14%.
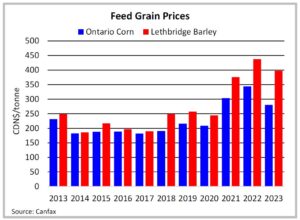
FEED GRAIN PRICES
- Lethbridge barley unevenly declined 16% between January and August, bottoming just prior to the 2024 harvest. Between August and December, Lethbridge barley climbed 15%.
- Lethbridge barley averaged $289/tonne in 2024, down 27% from 2023 and down 16% from the five-year average.
- Lethbridge barley was priced competitively against Alberta oats in 2024, but not against Omaha or Ontario corn.
- Ontario corn was largely rangebound in 2024, with a steady increase noted between July and December.
- Ontario corn averaged $214/tonne in 2024, down 24% from 2023 and down 21% from the five-year average.
- Omaha corn averaged C$232/tonne in 2024, down 26% from 2023 and down 14% from the five-year average.
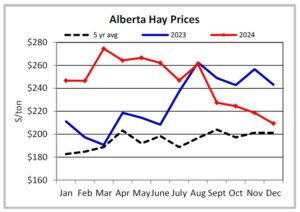
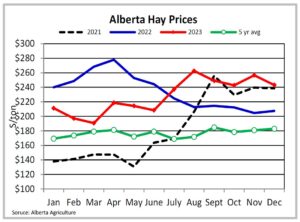
HAY PRICES
- The first half of 2024 saw elevated hay prices in Alberta, driven by dry weather in 2023. Timely rains in the summer of 2024 increased production and reduced prices for the 2024 crop.
- Alberta hay prices averaged $246/ton ($271/tonne), up 8% from 2023 and up 18% from the five-year average.
- Montana hay prices averaged US$137/ton (C$207/tonne) in 2024. This was at a discount to Alberta throughout 2024.
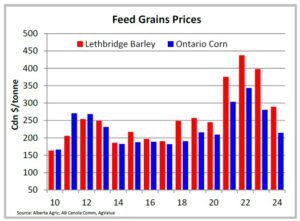
Bottom line: Lower feed prices have supported feeding margins. Ontario corn is still the cheapest feed in North America, followed by Omaha corn. Alberta barley is uncompetitive but by a narrower margin than previous years.
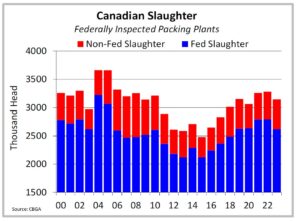
SLAUGHTER
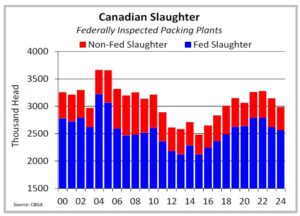
- Domestic (FI) slaughter was 2.99 million head in 2024, down 5%. This was below three million head for the first time since 2017, in part, due to the Cargill Guelph shutdown in June.
- Fed slaughter was 2.56 million head in 2024, down 2%. Non-fed slaughter was 422,000 head in 2024, down 19%.
- Rain in May reduced cow marketings and points to a more stable herd as industry moves into the consolidation phase. Moisture is needed before heifer retention occurs.
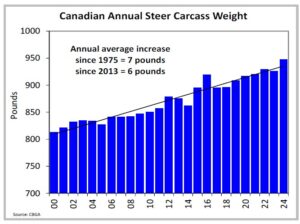
CARCASS WEIGHTS
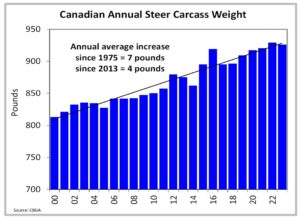
- Steer carcass weights averaged 948 lbs in 2024, 22 lbs heavier.
- Western Canadian steer carcasses averaged 940 lbs in 2024, 23 lbs heavier than 2023. Weights were notably heavier from January to April before being more current in the second half.
- Eastern Canadian steer carcasses averaged 972 lbs in 2024, 21 pounds heavier than 2023, and appeared immune to seasonal trends.
BEEF PRODUCTION
- Domestic beef production declined 2% in 2024, driven by non-fed production which was down 16%. Fed production in 2024 was steady with 2023. Production was supported by heavier carcass weights which offset smaller slaughter numbers.
- Live slaughter exports were up 18.6% at 538 million pounds.
- Total beef production (domestic, live slaughter exports and offals) was up a modest 0.3% at 3.45 billion pounds.
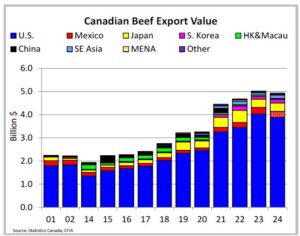
BEEF/CATTLE EXPORTS
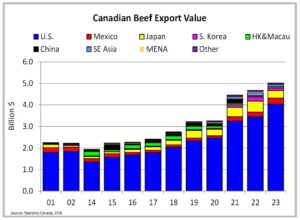
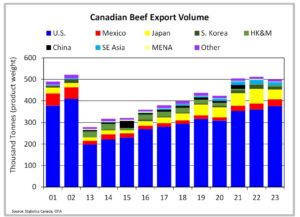
- In 2024 beef exports were down 1% at 495,000 metric tonnes; and down 2% to $4.93 billion, but remain the second largest on record. The top five destinations were the U.S. (76%), Japan (9%), Mexico (6%), South Korea (3%), and Southeast Asia (3%).
- Live cattle exports at 729,000 head in 2024, up 9% from 2023. Fed exports were 20-41% higher to be the largest since 2010, while non-fed exports were 9-12% lower. Feeder exports were down 20% to 103,000 head
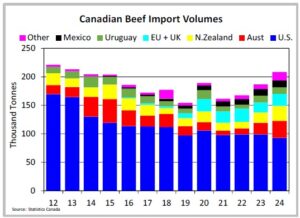
BEEF/CATTLE IMPORTS
- In 2024, beef imports were up 12% to 208,000 metric tonnes; and up 19% to $2.19 billion.
- Canada’s top five suppliers were the U.S. (45%), Australia (14%), New Zealand (13%), the EU and U.K. (10%). Uruguay and Mexico (6%) share fifth place.
- In 2024, feeder imports were up 24% to 356,500 head, the second largest after 2021. Leaving Canada a net feeder importer by 253,000 head fully offsetting the smaller calf crop with larger fourth quarter imports.
Bottom line: Domestic beef production in 2025 is projected to be steady to slightly smaller, depending on carcass weights. With live slaughter exports projected to be higher, assuming US tariffs are not applied. Imports are anticipated to remain historically large in 2025.
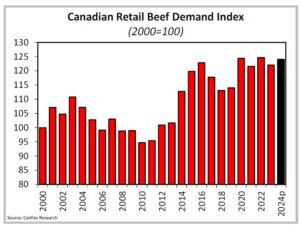
DEMAND
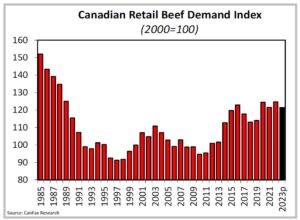
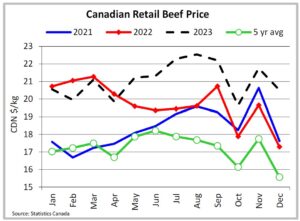
- Beef demand remains historically strong. Retail beef demand is projected higher in 2024 supported by stronger deflated retail prices and modest reductions in per capita consumption.
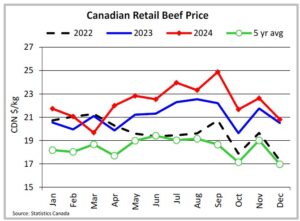
RETAIL PRICES/CONSUMPTION
- Nominal retail beef prices in 2024 were 6% higher in 2024 and 21% higher than the five-year average; deflated prices were 4% and 10% higher respectively.
- Deflated pork retail prices were 1% lower in 2024, with deflated retail chicken prices 7% lower.
- The beef-to-pork price ratio averaged 2.31:1 in 2024, the beef-to-chicken price ratio averaged 2.39:1
- Per capita meat consumption (including seafish) increased 4% in 2023 to 80 kg/person. Per capita beef consumption in 2023 averaged 16.2 kg/person, down 7% from 2022. Subsequently, beef market share was 25%, down from 28% in 2022. A growing population and tighter North American supplies are pressuring per capita consumption.
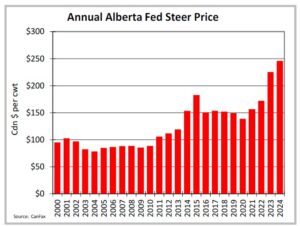
FED PRICES
- Alberta fed steers averaged $246/cwt in 2024, 9% stronger with seasonal trends. Ontario fed cattle prices were 6-10% stronger.
- On a deflated basis, Alberta fed steers were up 8% from 2023 with Ontario fed steers up 6%.
- The Alberta-to-Nebraska cash basis averaged -$12/cwt in 2024, $3/cwt stronger than 2023 but $4/cwt weaker than the five-year average.
- Feedlot margins in 2024 were estimated to be negative on average for most classes of cattle with the exception of steer calves and shortkeep steers.
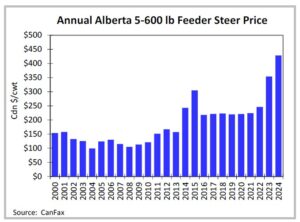
FEEDER PRICES
- In 2024, Alberta 550 lb steer calves averaged $429/cwt, 21% higher than 2023, Ontario steer calves averaged $412/cwt, up 26%, and U.S. steer calves averaged C$424/cwt up 21%. During the fourth quarter, a six percent weakening of the Canadian dollar supported feeder prices along with a stronger futures market and tight supplies.
- In 2024, Alberta 550 lb steer calves averaged a $16/cwt premium to Ontario calves and a $5/cwt premium to the U.S.
- In 2024, Alberta 850 lb steers averaged $331/cwt 16% stronger than 2023 with Ontario at $335/cwt and the U.S. at C$326/cwt. In 2024, Alberta 850 feeder steers were at a $4/cwt discount to same-weight Ontario steers but were at a $5/cwt premium to the U.S.
Bottom line: In the first quarter of 2025, feeder prices remain strong with fundamental support. However, there are also expectations of stronger prices in the second half of the year as supplies tighten. Market volatility is expected throughout 2025 with an ongoing trade war. Livestock Price Insurance provides a price floor, protecting against downside risk, while leaving the upside open.
Join LPI as we dispel common myths and answer important questions about the Livestock Price Insurance program.
Myth: Producers are locked in at a set market price, diminishing their profits in an upward trending market.
LPI protects producers from downward trending markets with a protected floor price but enables them to sell at higher profits.
Join Jeff as he talks about how LPI can protect you in a downward-trending market.
Join LPI as we dispel common myths and answer important questions about the Livestock Price Insurance program.
Question: What is the best way to use LPI?
Make the most out of the LPI program by incorporating these tips into your policy purchasing plan:
- Understand your business: Make sound business decisions by knowing your cost of production and margins.
- Monitor the LPI premium tables: Keep up to date on market fluctuations by monitoring LPI premium tables and weekly market information. Producers can use this information to capitalize on coverage advantageous to their operation.
- Purchase multiple policies with different expiry dates: Distribute your risk by purchasing multiple policies over a period of time instead of buying coverage for all animals at once. Insuring livestock with different policy expiry dates can be a beneficial way to split marketing and price risk, particularly if producers sell their animals over a few weeks of time.
Join Brett as he provides insight into the best way to use the LPI program.
Join LPI as we dispel common myths and answer important questions about the Livestock Price Insurance program. Now that calf policies are available for 2025, it’s the perfect time to learn more about LPI.
Question: What is the purpose of the LPI program?
Livestock Price Insurance is a business risk management program where producers can purchase price protection on cattle and hogs in the form of an insurance policy. The program allows producers to take control and effectively manage their risk against unforeseen market price events impacting price, currency, and basis. LPI is the only tool in Canada that covers all three risk factors producers face.
LPI offers peace of mind by protecting your livestock against unknown market fluctuations. Producers pay a premium to receive forward price coverage. If the market price falls below the insured index (also known as the coverage price), LPI will pay the difference to compensate the producer for the loss. If the market price rises above the coverage price, the producer can benefit by selling livestock in a rising market. The program covers producers for declining price movements but does not limit the upwards price movement potential.
Join Brenda as she discusses the purpose of the program.
If you have questions or would like more information on Livestock Price Insurance, please contact your provincial Livestock Price Insurance office.
Join LPI as we dispel common myths and answer important questions about the Livestock Price Insurance program.
Myth: LPI controls how a producer spends their claim payment.
Producers have full control over how they spend their indemnity payments. Whether it’s compensating for their monetary loss, re-investing in current livestock, or putting the payment toward other operational costs on the farm, it’s up to the producer to decide.
Join Courtney as she dispels the myth around how LPI claim payments are spent.
If you have questions or would like more information on Livestock Price Insurance, please contact your provincial Livestock Price Insurance office.
Feed grain prices moderated throughout 2023, supporting feeder prices. On a deflated basis (1992=100) most classes of feeder and fed cattle in Alberta and Ontario approached previous all-time high prices. Domestic beef production declined 5 per cent, as drought across North America over the last three years moved heifers into feedlots. Beef export volumes declined slightly; but values were record high. Cattle inventories are expected to be smaller in 2024, providing fundamental support to cattle prices. Larger beef imports are anticipated to fill the void with shrinking North American beef production.
The Canadian economy appears to have stabilized by the end of 2023 with current numbers (1.5 per cent GDP growth) outpacing original expectations (1 per cent). Inflation is moderating and economists are expecting interest rate cuts to begin mid-year. The Canadian Dollar averaged near US$0.74 in 2023.
North American cattle inventories are driven by the U.S. herd. The U.S. cattle herd on January 1st, 2024 was down 1.9 per cent from 2023, to 87.2 million head, beef cows were down 2.5 per cent to 28.2 million head, and beef breeding heifers were down 1.4 per cent to 4.9 million head. Smaller numbers have been offset by larger carcass weights. The Canadian cattle herd was down 2.1 per cent to 11.1 million head as of January 1st, 2024, beef cows were down 2.4 per cent to 3.46 million head and beef breeding heifers were down 5.6 per cent to 519,600 head. North American heifer retention, thought to begin in 2023, will be delayed until at least the fall of 2024, subject to adequate moisture.
Bottom line: Ongoing drought conditions continue to delay the expansion phase of the cattle cycle. A smaller North American beef herd in 2024 will reduce beef production, supporting prices throughout the supply chain. It remains to be seen how consumer demand holds up in 2024.
2023 MACROECONOMIC OVERVIEW
- The inflation rate declined from 5.9 per cent in January 2023 to 3.4 per cent by December 2023, though the ride has been bumpy
- The prime interest rate rose from 6.7 per cent in January to 7.2 per cent by December to combat higher inflation. The interest rate has been steady since July 2023
- The unemployment rate was 5 per cent in January, but slowly and inconsistently increased to 5.8 per cent by December 2023
- The Canadian economy outpaced expectations in 2023, re-igniting the possibility of a ‘soft landing’ in 2024
2023/24P BARLEY SUPPLY AND DISPOSITION
- Canadian barley production totaled 8.9 million metric tonnes, 11 per cent lower than 2022, and steady with the 10-year average
- Barley exports in 2023/24 are projected at 2.78 million metric tonnes, down 28 per cent from 2022/23
- Total domestic use in 2023/24 is projected at 5.91 million metric tonnes, 1 per cent lower than 2022/23
- Ending stocks in 2023/24 are projected at one million metric tonnes, 41 per cent higher than 2022/23
- The stocks-to-use ratio in 2023/24 is projected at 17 per cent, compared to the five-year average of 12 per cent
2023/24P CORN SUPPLY AND DISPOSITION
- Canadian corn production totaled 15.08 million metric tonnes, the largest on record and 4 per cent higher than 2022
- Exports in 2023/24 are projected at 2.85 million metric tonnes down 35 per cent from 2022/23
- Total domestic use in 2023/24 is projected at 15.45 million metric tonnes, 4 per cent higher than 2022/23
- Ending stocks in 2023/24 are projected at 1.9 million metric tonnes, 17 per cent higher than 2022/23
- The stocks-to-use ratio in 2023/24 is projected at 12 per cent, lower than the 10-year average of 15 per cent
FEED GRAIN PRICES
- Feed grain prices steadily declined in 2023. Between January and December 2023, barley prices dropped 26 per cent, Ontario corn prices dropped 32 per cent
- China’s trade action against Australia was lifted in August 2023, reducing demand for Canadian barley
- New crop (2023/24) barley and corn prices were considerably lower compared to old crop (2022/23) prices
- Lethbridge barley averaged just shy of $400/tonne, a 9 per cent reduction from 2022, but was still priced at a premium to all feed grain substitutes
- Ontario corn averaged $281/tonne, down 18 per cent from 2022
- Omaha corn averaged C$312/tonne, down 16 per cent from 2022
HAY PRICES
- Drought conditions in Western Canada pushed hay prices higher in 2023. Second half 2023 Alberta hay prices were priced at a premium compared to the first half.
- Alberta hay prices averaged $228/ton ($251/tonne) in 2023, down 3 per cent from 2022
- Montana hay prices averaged US$212/ton (C$315/tonne), down 13 per cent from 2022. In the second half of 2023, Montana hay prices moved lower to a discount compared to Alberta
Bottom line: Barley production in 2024/25 is forecast to increase 4 per cent from 2023/24. Corn production is forecast to decrease 5 per cent but will still be the fourth highest on record. Feed input prices are expected to moderate in 2024.
SLAUGHTER
- Canadian slaughter (FI only) totaled 3.14 million head in 2023, down 4 per cent, supported by non-fed animals
- Fed slaughter totaled 2.62 million head in 2023, down 6 per cent. Non-fed slaughter totaled 523,144 head in 2023, up 8 per cent (cows +7 per cent; bulls +28 per cent)
- Total slaughter was down 6 per cent in the west and down 8 per cent in the east. Non-fed slaughter was up 9 per cent in the west; and up 5 per cent in the east
CARCASS WEIGHTS
- Steer carcass weights averaged 926 lbs in 2023, three pounds lighter than 2022
- Western Canadian steer carcasses averaged 917 lbs in 2023, seven pounds lighter than 2022. Steer carcass weights moved to be record heavy in the fourth quarter
- Eastern Canadian steer carcasses averaged 958 lbs in 2023, seven pounds heavier than 2022
BEEF PRODUCTION
- Total domestic beef production in 2023 totaled 2.7 billion pounds, down 5 per cent from 2022. Fed production totaled 2.3 billion pounds, down 7 per cent from 2022. Non-fed production totaled almost 390 million pounds, up 9 per cent from 2022
BEEF/CATTLE EXPORTS
- Beef export volumes for 2023 were down 2 per cent from 2022 to 499 million metric tonnes; values were 7 per cent higher at $5.02 billion to be the highest on record
- The top five destinations for Canadian beef by market share are the U.S. (75 per cent), Japan (9 per cent) Mexico (7 per cent), South Korea (3 per cent), and Southeast Asia (3 per cent)
- Live cattle exports totaled 670,000 head in 2023, down 6 per cent from 2022.
- Slaughter export volumes were steady with 2022. Fed steers and heifer exports were 10-13 per cent higher; non-fed exports were 15-16 per cent lower. Feeder export volumes were down 26 per cent in 2023 to just under 130,000 head
BEEF/CATTLE IMPORTS
- Beef import volumes in 2023 were up 11 per cent from 2022 to 186.6 million metric tonnes; import values were up 12 per cent to $1.84 billion
- Canada’s top five suppliers of beef by market share are the U.S. (53 per cent), Australia (11 per cent), New Zealand (10 per cent), the EU and U.K. (9 per cent). Uruguay and Mexico (6 per cent) share fifth place
- In 2023, feeder import volumes were 2 per cent lower than 2022; leaving Canada a net importer of feeder cattle by almost 160,000 head
Bottom line: Domestic beef production is projected to have a smaller decline in 2024, compared with what was seen in 2023.
DEMAND
- Domestic demand declined slightly in 2023, driven by reduced supplies but remained historically high, at levels comparable to the late 1980s
- The international beef demand index increased in 2023 to be the highest on record
- Beef market share as a percent of total protein consumption in 2022 was steady with 2021 at 29 per cent
RETAIL PRICES/CONSUMPTION
- Nominal retail beef prices in 2023, were on average 7 per cent higher than 2022; deflated prices were 3 per cent higher
- Deflated retail prices for pork and chicken were 8 per cent and 0.4 per cent lower respectively
- The beef-to-pork price ratio averaged 2.2:1 in 2023, the beef-to-chicken price ratio averaged 2.14:1
- Per capita meat consumption (including seafish) increased 4 per cent in 2022 to 80 kg/person
- Per capita beef consumption in 2022 averaged 17.5 kg/person, up 3 per cent from 2021
FED PRICES
- Fed cattle prices in both Alberta and Ontario peaked in June 2023, as feedlots moved to be very current
- Alberta fed cattle were 29-31 per cent stronger in 2023 compared to 2022; Ontario fed cattle were 24-27 per cent stronger (nominal prices)
- Deflated Alberta fed steer prices matched their previous all-time highs set in 2015
- The Alberta-to-Nebraska cash basis averaged -$14/cwt in 2023, the third weakest on record
- Feedlot margins were estimated to be positive on average for 2023, but dipped negative in December
FEEDER PRICES
- Alberta and Ontario feeder steer prices continuously strengthened from January to September, setting new all-time highs (nominal) as the fall run began
- Alberta steers under 700 lbs were 41-47 per cent stronger than 2022; steers 700 lbs and over were 34-39 per cent stronger
- Ontario steers under 700 lbs were 35-36 per cent stronger than 2022; steers 700 lbs and over were 32-35 per cent stronger
- Alberta 550 lb steers were consistently at a premium to Ontario, averaging a $26/cwt premium in 2023
- Alberta 850 lb steers were inconsistent against the Ontario market, but averaged a $2/cwt premium in 2023
- Deflated Alberta 550 lb and 850 lb steer prices were 6 per cent and 5 per cent respectively below their all-time highs set in 2015; Ontario steers were 10 per cent and 3 per cent below 2015
Bottom line: Prices continue to have fundamental supply support. Given volatility sone the fourth quarter of 2023, producers should remember that Livestock Price Insurance protects against downside risk while leaving the upside open.
As of April 1, the LPI-Fed settlement index will not include any cash prices that are outside +/- 5% of the average weekly mean. Previously, the LPI-Fed settlement index did not include any cash prices that were $4/CWT above or below the average weekly mean.
Producers will continue to settle policies as usual. The data collected for calculating the settlement index is not affected by this change, only the analysis of data to include in our index.
In rare cases, the $4/cwt rule caused settlement blackout weeks. For example, in late 2022, the LPI-Fed settlement index excluded a larger-than-usual number of outliers (31 per cent within four out of five weeks) and the $4/cwt rule resulted in a blackout week. If the +/-5% rule had been in place, a blackout week would not have been necessary.
The rule modification accommodates current and future changes to the Livestock Price Insurance (LPI) settlement index, ensures price data producers reasonably consider part of the cash market is incorporated into the index, and maintains producer confidence in the Fed product.
LPI–Cattle settlement indexes are calculated on a weekly basis and outlier rules are incorporated into the calculation to automatically exclude data outside of LPI’s parameters. These outlier rules exist to ensure that correct data is included in the settlement indexes and eliminate human error.
The LPI-Fed product relies on cash data reported to Canfax weekly. Without cash data, the program does not exist. With ongoing issues sourcing weekly cash data, this change will help mitigate the risk of not having enough data to publish an index.
If you have questions or would like more information, please contact your provincial Livestock Price Insurance office.
LPI-calf insurance can help protect producers’ investment in their calf crop and give them peace of mind even as markets fluctuate. This easy-to-use risk management program is offered in the spring and covers the price risk cow-calf producers face when selling calves in the market. Producers can tailor coverage to their operation by purchasing price insurance for anticipated calf sales.
This market-driven program uses several factors to forecast future calf prices. During the policy purchasing period, the coverage offered is calculated three days a week using market data from each given day. Policies are available for purchase Tuesday, Wednesday and Thursday from 2 to 11 p.m. MT.
Calf policies are available for purchase until June 8, 2023 with expiry dates into February 2024.
We put so much planning into our operation, but markets can be so unpredictable. Farming in Canada has its challenges; it’s always good to have a plan to fall back on. Having protection to give peace of mind in the midst of uncertainty is crucial.
Making it easier
LPI has several features and resources for producers on its website LPI.ca
Understanding Premiums & Settlements: This new section explains the ins and outs of the premium tables and settlements. Look here for information on how to read a premium table and when to access your claim window.
Need Help: This section has valuable help resources, including How to Create an online LPI Account, How to Purchase an LPI Policy online, and How to Claim on an LPI Policy online.
LPI Workpad: This useful tool aids producers when making purchasing decisions. The workpad provides producers with the option to calculate up to three example purchases prior to making any purchasing decisions. It clearly communicates policy details for best decision-making practices.
Producers can purchase Livestock Price Insurance every Tuesday, Wednesday or Thursday from 2 to 11 p.m. MT. Claims can be made on Mondays between 2 and 11 p.m. MT. If you require assistance, please contact your provincial LPI office.