New market information available: Settlement price and weight data graphs
November 25, 2025Are you curious about the cash sale prices and lot weights that form the weekly Livestock Price Insurance (LPI) Feeder and Calf settlement indexes? We are breaking down the index for you.
Recent updates to LPI market information include settlement price and weight graphs, enhancing understanding of how auction data shapes settlement indexes.
What are the settlement price graphs?
The settlement price graphs below show a visual summary of the cash sale prices collected weekly that are used to build out the LPI Calf and Feeder settlement indexes.
The cash sales data is derived from participating auction markets in BC, Alberta, Saskatchewan and Manitoba. Auction markets send us their raw files directly after sale closeout (same data used to pay their clients). The data is then filtered by our Pricing department to include only lots that fit the parameters of the LPI Feeder and Calf products.
Understanding the settlement price graphs
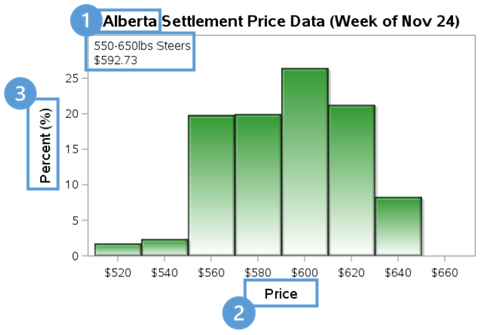
- Identify what region (Alberta or SaskMan), weight ranges (Calf or Feeder), and settlement index (cash price for the week) the graph represents
- Bars within the graph represent the range of cash prices used to calculate the weekly settlement index.
- Height of the bars within the graphs represent the percentage of cattle that received a cash price in the specified ranges.
In this example, the largest group of prices included within the index are in the price range of $560-620/cwt and more than 25 per cent of the cash sales included in the weekly index were in the $600/cwt price range.
What are the settlement weight graphs?
The settlement weight graphs below show a visual summary of animals weights collected on a weekly basis with their cash sale price used to build out the LPI Calf and Feeder settlement indexes.
Understanding the settlement weight graphs
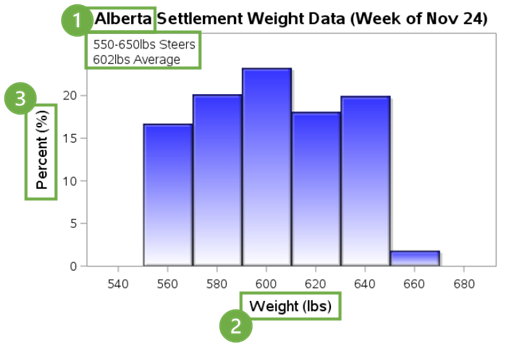
- Identify what region (Alberta or SaskMan), weight ranges (Calf or Feeder), and average weight the graph represents
- Bars within the graphs represent the range of animal weights used to calculate the weekly settlement index
- Height of the bars within the graphs represent the percentage of head within that weight range in the settlement index
The Calf settlement index is calculated from calves that weigh between 550-650lbs. In this example, more than three of the 20lbs weight ranges made up over 20 per cent of the data in the weekly settlement index.
Need to refresh your memory on the parameters of the Calf and Feeder settlement indexes?
Visit the About LPI – Cattle page to learn more about how the data we gather is used for the settlement of policies as well as these graphs.
Raw auction market sales data will not be disclosed due to contractual obligations. For a list of participating auction markets visit, LPI.ca/participating-auction-markets.